Aggressive scrape cadence under load
What does frequent Prometheus scraping during load cost versus listener-only scrape?
Numbers are same-host comparisons on a single reference host and are not service-level objectives. See the performance hub disclaimer.
When this matters
Opening a Prometheus listen address without concurrent scrapes underestimates
export-path cost. This study adds a lab scrape hammer (HTTP GET to
/metrics about every 100 ms) while dnsperf runs, compared to observability off
and standard scrape with the listener idle. Use it when your Prometheus (or other
scraper) hits Conduit aggressively under peak traffic.
What we varied
- Varied: scrape cadence posture
(
metrics_off,metrics_standard_scrape,metrics_standard_scrape_hammer) - Held fixed:
sync,forward_fast, standard base on the scrape configurations
Evidence
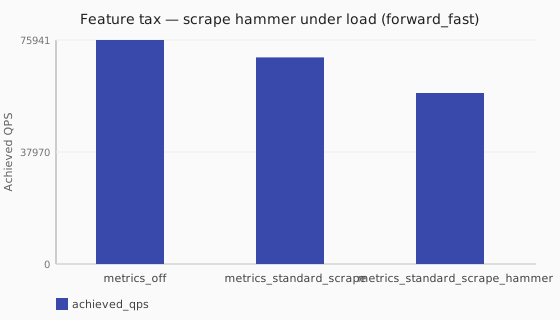
Feature tax — scrape hammer under load (forward_fast)
| Posture | Runtime | Achieved QPS | Avg latency (ms) | Sent | Completed | Lost | Workers |
|---|---|---|---|---|---|---|---|
| metrics_off | sync | 75940.7 | 26.3 | 761386 | 761386 | 0 | ingress=2 |
| metrics_standard_scrape | sync | 70029.9 | 28.5 | 703153 | 703153 | 0 | ingress=2 |
| metrics_standard_scrape_hammer | sync | 57968.8 | 34.4 | 582917 | 582917 | 0 | ingress=2 |
At a glance
- scrape hammer under load (forward_fast):
metrics_standard_scrapecosts about 8% QPS versusmetrics_off(~70k vs ~76k);metrics_standard_scrape_hammercosts about 24% QPS versusmetrics_off(~58k vs ~76k).
Takeaway
A much hotter scraper adds a clear extra tax beyond standard scrape on this median. Versus observability off (~76k), standard scrape costs about 8% (~70k); aggressive external scrape (~10/s) about 24% (~58k).
What to do: size standing scrape cost from the metrics scrape tax and collect vs emit. Choose your scrape interval for ops needs; remeasure if your scraper is as hot as this lab hammer.
Related guides
Member scenarios
- feature-tax-metrics-off-forward-fast
- feature-tax-metrics-standard-scrape-forward-fast
- feature-tax-metrics-standard-scrape-hammer-forward-fast